微软出品
Please check the Releases section on the project's GitHub page at https://aka.ms/diskspd to access the latest set of pre-compiled binaries (ZIP) and source code.
The latest documentation can be found at https://github.com/Microsoft/diskspd/wiki.
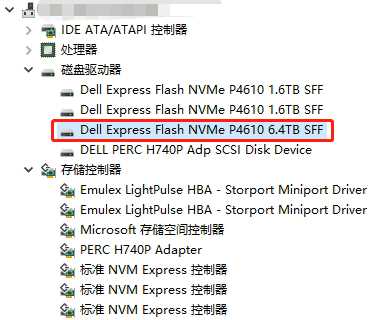
DELL NVMe P4610 6.4TB硬盘进行性能测试,以记录之。
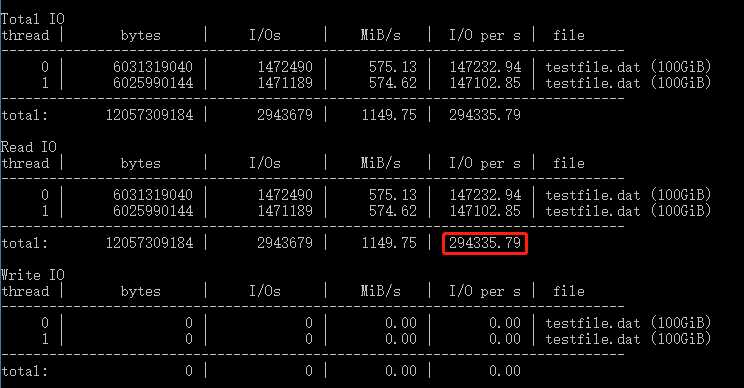
1、使用已存在的testfile.dat文件,测试随机读性能:块大小4KB,每文件创建2个线程,队列深度32,持续时间10s,禁用软硬件缓存
diskspd.exe -b4K -t2 -o32 -d10 -Sh -r testfile.dat
-d 用于指定测试时长,默认为 10 秒(不包括冷却和预热时间)。
-F 用于定义基准测试线程数。
-w 用于指定写入请求的百分比,默认写入请求为读取请求的 100%。
-b [K|M|G] 用于指定存储块大小。K/M/G 分别定义 KB/MB和GB,默认块大小为 64 KB。
-o 用于设置每个目标线程的未完成 I/O 请求的数。1表示进程同步,2表示进程异步。
-r 随机 I/O 对齐测试
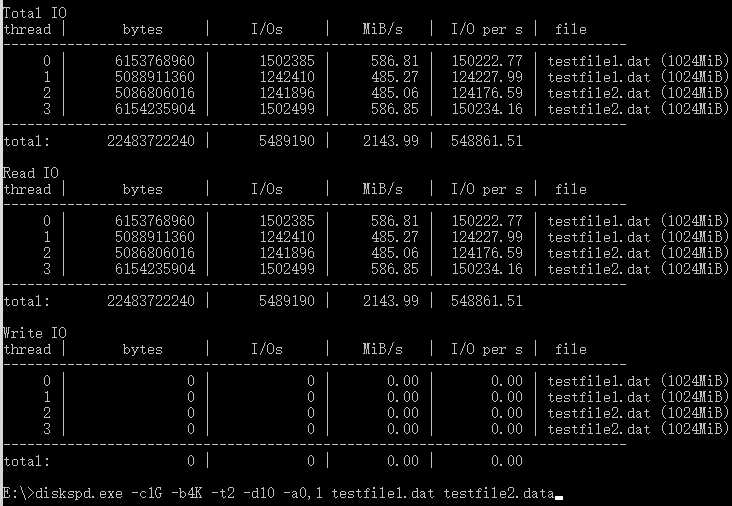
创建两个1GB的文件,将块大小设置为4KB,每个文件创建两个线程,亲化线程到cpu 0和1(每个文件都有与这两个cpu密切相关的线程)并运行读测试持续10秒:
diskspd.exe -c1G -b4K -t2 -d10 -a0,1 testfile1.dat testfile2.dat

E:\>diskspd.exe -c1G -b4K -t2 -d10 -a0,1 testfile1.dat testfile2.dat
WARNING: target access pattern will not be sequential, consider -si

Command Line: diskspd.exe -c1G -b4K -t2 -d10 -a0,1 testfile1.dat testfile2.dat

Input parameters:

        timespan:   1
        -------------
        duration: 10s
        warm up time: 5s
        cool down time: 0s
        random seed: 0
        advanced affinity round robin (group/core): 0/0, 0/1
        path: 'testfile1.dat'
                think time: 0ms
                burst size: 0
                using software cache
                using hardware write cache, writethrough off
                performing read test
                block size: 4096
                using sequential I/O (stride: 4096)
                number of outstanding I/O operations: 2
                thread stride size: 0
                threads per file: 2
                using I/O Completion Ports
                IO priority: normal
        path: 'testfile2.dat'
                think time: 0ms
                burst size: 0
                using software cache
                using hardware write cache, writethrough off
                performing read test
                block size: 4096
                using sequential I/O (stride: 4096)
                number of outstanding I/O operations: 2
                thread stride size: 0
                threads per file: 2
                using I/O Completion Ports
                IO priority: normal

System information:

        computer name: WIN-43Q2JUQ3N4D
        start time: 2020/11/08 15:09:38 UTC

Results for timespan 1:
*******************************************************************************

actual test time:       10.00s
thread count:           4
proc count:             64

Group | CPU |  Usage |  User  |  Kernel |  Idle
-------------------------------------------
     0|    0| 100.00%|  16.09%|   83.91%|   0.00%
     0|    1| 100.00%|  16.88%|   83.13%|   0.00%
     0|    2|   0.00%|   0.00%|    0.00%| 100.00%
     0|    3|   0.00%|   0.00%|    0.00%| 100.00%
     0|    4|   0.00%|   0.00%|    0.00%| 100.00%
     0|    5|   0.00%|   0.00%|    0.00%| 100.00%
     0|    6|   0.00%|   0.00%|    0.00%| 100.00%
     0|    7|   0.00%|   0.00%|    0.00%| 100.00%
     0|    8|   0.00%|   0.00%|    0.00%| 100.00%
     0|    9|   0.31%|   0.31%|    0.00%|  99.69%
     0|   10|   0.00%|   0.00%|    0.00%| 100.00%
     0|   11|   0.00%|   0.00%|    0.00%| 100.00%
     0|   12|   0.00%|   0.00%|    0.00%| 100.00%
     0|   13|   0.00%|   0.00%|    0.00%| 100.00%
     0|   14|   0.00%|   0.00%|    0.00%| 100.00%
     0|   15|   0.00%|   0.00%|    0.00%| 100.00%
     0|   16|   0.00%|   0.00%|    0.00%| 100.00%
     0|   17|   0.00%|   0.00%|    0.00%| 100.00%
     0|   18|   0.00%|   0.00%|    0.00%| 100.00%
     0|   19|   0.00%|   0.00%|    0.00%| 100.00%
     0|   20|   0.00%|   0.00%|    0.00%| 100.00%
     0|   21|   0.00%|   0.00%|    0.00%| 100.00%
     0|   22|   0.00%|   0.00%|    0.00%| 100.00%
     0|   23|   0.00%|   0.00%|    0.00%| 100.00%
     0|   24|   0.00%|   0.00%|    0.00%| 100.00%
     0|   25|   0.00%|   0.00%|    0.00%| 100.00%
     0|   26|   0.00%|   0.00%|    0.00%| 100.00%
     0|   27|   0.00%|   0.00%|    0.00%| 100.00%
     0|   28|   0.00%|   0.00%|    0.00%| 100.00%
     0|   29|   0.00%|   0.00%|    0.00%| 100.00%
     0|   30|   0.00%|   0.00%|    0.00%| 100.00%
     0|   31|   0.00%|   0.00%|    0.00%| 100.00%
     1|    0|   0.00%|   0.00%|    0.00%| 100.00%
     1|    1|   0.00%|   0.00%|    0.00%| 100.00%
     1|    2|   0.00%|   0.00%|    0.00%| 100.00%
     1|    3|   0.00%|   0.00%|    0.00%| 100.00%
     1|    4|   0.00%|   0.00%|    0.00%| 100.00%
     1|    5|   0.31%|   0.00%|    0.31%|  99.69%
     1|    6|   0.00%|   0.00%|    0.00%| 100.00%
     1|    7|   0.16%|   0.00%|    0.16%|  99.84%
     1|    8|   0.00%|   0.00%|    0.00%| 100.00%
     1|    9|   0.00%|   0.00%|    0.00%| 100.00%
     1|   10|   0.00%|   0.00%|    0.00%| 100.00%
     1|   11|   0.00%|   0.00%|    0.00%| 100.00%
     1|   12|   0.16%|   0.16%|    0.00%|  99.84%
     1|   13|   0.00%|   0.00%|    0.00%| 100.00%
     1|   14|   0.00%|   0.00%|    0.00%| 100.00%
     1|   15|   0.00%|   0.00%|    0.00%| 100.00%
     1|   16|   0.00%|   0.00%|    0.00%| 100.00%
     1|   17|   0.00%|   0.00%|    0.00%| 100.00%
     1|   18|   0.00%|   0.00%|    0.00%| 100.00%
     1|   19|   0.00%|   0.00%|    0.00%| 100.00%
     1|   20|   0.00%|   0.00%|    0.00%| 100.00%
     1|   21|   0.00%|   0.00%|    0.00%| 100.00%
     1|   22|   0.00%|   0.00%|    0.00%| 100.00%
     1|   23|   0.00%|   0.00%|    0.00%| 100.00%
     1|   24|   0.00%|   0.00%|    0.00%| 100.00%
     1|   25|   0.00%|   0.00%|    0.00%| 100.00%
     1|   26|   0.00%|   0.00%|    0.00%| 100.00%
     1|   27|   0.00%|   0.00%|    0.00%| 100.00%
     1|   28|   0.00%|   0.00%|    0.00%| 100.00%
     1|   29|   0.00%|   0.00%|    0.00%| 100.00%
     1|   30|   0.00%|   0.00%|    0.00%| 100.00%
     1|   31|   0.00%|   0.00%|    0.00%| 100.00%
-------------------------------------------
        avg.|   3.14%|   0.52%|    2.62%|  96.86%

Total IO
thread |       bytes     |     I/Os     |    MiB/s   |  I/O per s |  file
------------------------------------------------------------------------------
     0 |      6153768960 |      1502385 |     586.81 |  150222.77 | testfile1.dat (1024MiB)
     1 |      5088911360 |      1242410 |     485.27 |  124227.99 | testfile1.dat (1024MiB)
     2 |      5086806016 |      1241896 |     485.06 |  124176.59 | testfile2.dat (1024MiB)
     3 |      6154235904 |      1502499 |     586.85 |  150234.16 | testfile2.dat (1024MiB)
------------------------------------------------------------------------------
total:       22483722240 |      5489190 |    2143.99 |  548861.51

Read IO
thread |       bytes     |     I/Os     |    MiB/s   |  I/O per s |  file
------------------------------------------------------------------------------
     0 |      6153768960 |      1502385 |     586.81 |  150222.77 | testfile1.dat (1024MiB)
     1 |      5088911360 |      1242410 |     485.27 |  124227.99 | testfile1.dat (1024MiB)
     2 |      5086806016 |      1241896 |     485.06 |  124176.59 | testfile2.dat (1024MiB)
     3 |      6154235904 |      1502499 |     586.85 |  150234.16 | testfile2.dat (1024MiB)
------------------------------------------------------------------------------
total:       22483722240 |      5489190 |    2143.99 |  548861.51

Write IO
thread |       bytes     |     I/Os     |    MiB/s   |  I/O per s |  file
------------------------------------------------------------------------------
     0 |               0 |            0 |       0.00 |       0.00 | testfile1.dat (1024MiB)
     1 |               0 |            0 |       0.00 |       0.00 | testfile1.dat (1024MiB)
     2 |               0 |            0 |       0.00 |       0.00 | testfile2.dat (1024MiB)
     3 |               0 |            0 |       0.00 |       0.00 | testfile2.dat (1024MiB)
------------------------------------------------------------------------------
total:                 0 |            0 |       0.00 |       0.00
2、使用2个线程和1个未完成的IO进行4KB顺序写入
diskspd.exe -c100G -t2 -si4K -b4K -d30 -L -o1 -w100 -D -h testfile.dat

D:\>c:\diskspd.exe -c100G -t2 -si4K -b4K -d30 -L -o1 -w100 -D -h testfile.dat

Command Line: c:\diskspd.exe -c100G -t2 -si4K -b4K -d30 -L -o1 -w100 -D -h testfile.dat

Input parameters:

        timespan:   1
        -------------
        duration: 30s
        warm up time: 5s
        cool down time: 0s
        measuring latency
        gathering IOPS at intervals of 1000ms
        random seed: 0
        path: 'testfile.dat'
                think time: 0ms
                burst size: 0
                software cache disabled
                hardware write cache disabled, writethrough on
                performing write test
                block size: 4096
                using interlocked sequential I/O (stride: 4096)
                number of outstanding I/O operations: 1
                thread stride size: 0
                threads per file: 2
                IO priority: normal

System information:

        computer name: WIN-43Q2JUQ3N4D
        start time: 2020/11/08 14:37:40 UTC

Results for timespan 1:
*******************************************************************************

actual test time:       30.00s
thread count:           2
proc count:             64

Group | CPU |  Usage |  User  |  Kernel |  Idle
-------------------------------------------
     0|    0|  58.65%|   5.10%|   53.54%|  41.35%
     0|    1|  58.28%|   5.78%|   52.50%|  41.72%
     0|    2|   0.05%|   0.00%|    0.05%|  99.95%
     0|    3|   0.00%|   0.00%|    0.00%| 100.00%
     0|    4|   0.16%|   0.10%|    0.05%|  99.84%
     0|    5|   0.00%|   0.00%|    0.00%| 100.00%
     0|    6|   0.10%|   0.05%|    0.05%|  99.90%
     0|    7|   0.10%|   0.05%|    0.05%|  99.90%
     0|    8|   0.21%|   0.00%|    0.21%|  99.79%
     0|    9|   0.10%|   0.10%|    0.00%|  99.90%
     0|   10|   0.16%|   0.10%|    0.05%|  99.84%
     0|   11|   0.00%|   0.00%|    0.00%| 100.00%
     0|   12|   0.21%|   0.00%|    0.21%|  99.79%
     0|   13|   4.01%|   1.88%|    2.14%|  95.99%
     0|   14|   0.42%|   0.21%|    0.21%|  99.58%
     0|   15|   0.05%|   0.00%|    0.05%|  99.95%
     0|   16|   0.05%|   0.00%|    0.05%|  99.95%
     0|   17|   0.05%|   0.05%|    0.00%|  99.95%
     0|   18|   0.00%|   0.00%|    0.00%| 100.00%
     0|   19|   0.00%|   0.00%|    0.00%| 100.00%
     0|   20|   0.10%|   0.05%|    0.05%|  99.90%
     0|   21|   0.16%|   0.00%|    0.16%|  99.84%
     0|   22|   0.21%|   0.10%|    0.10%|  99.79%
     0|   23|   0.10%|   0.10%|    0.00%|  99.90%
     0|   24|   0.05%|   0.05%|    0.00%|  99.95%
     0|   25|   0.00%|   0.00%|    0.00%| 100.00%
     0|   26|   0.05%|   0.05%|    0.00%|  99.95%
     0|   27|   0.05%|   0.00%|    0.05%|  99.95%
     0|   28|   0.16%|   0.05%|    0.10%|  99.84%
     0|   29|   0.05%|   0.00%|    0.05%|  99.95%
     0|   30|   0.00%|   0.00%|    0.00%| 100.00%
     0|   31|   0.21%|   0.05%|    0.16%|  99.79%
     1|    0|   0.00%|   0.00%|    0.00%| 100.00%
     1|    1|   0.10%|   0.10%|    0.00%|  99.90%
     1|    2|   0.05%|   0.05%|    0.00%|  99.95%
     1|    3|   0.21%|   0.10%|    0.10%|  99.79%
     1|    4|   0.10%|   0.10%|    0.00%|  99.90%
     1|    5|   0.00%|   0.00%|    0.00%| 100.00%
     1|    6|   0.05%|   0.05%|    0.00%|  99.95%
     1|    7|   0.16%|   0.00%|    0.16%|  99.84%
     1|    8|   0.21%|   0.21%|    0.00%|  99.79%
     1|    9|   0.16%|   0.05%|    0.10%|  99.84%
     1|   10|   0.00%|   0.00%|    0.00%| 100.00%
     1|   11|   0.00%|   0.00%|    0.00%| 100.00%
     1|   12|   0.16%|   0.10%|    0.05%|  99.84%
     1|   13|   0.00%|   0.00%|    0.00%| 100.00%
     1|   14|   0.00%|   0.00%|    0.00%| 100.00%
     1|   15|   0.00%|   0.00%|    0.00%| 100.00%
     1|   16|   0.00%|   0.00%|    0.00%| 100.00%
     1|   17|   0.00%|   0.00%|    0.00%| 100.00%
     1|   18|   0.10%|   0.10%|    0.00%|  99.90%
     1|   19|   0.05%|   0.05%|    0.00%|  99.95%
     1|   20|   0.00%|   0.00%|    0.00%| 100.00%
     1|   21|   0.00%|   0.00%|    0.00%| 100.00%
     1|   22|   0.73%|   0.16%|    0.57%|  99.27%
     1|   23|   0.00%|   0.00%|    0.00%| 100.00%
     1|   24|   0.10%|   0.05%|    0.05%|  99.90%
     1|   25|   0.00%|   0.00%|    0.00%| 100.00%
     1|   26|   0.00%|   0.00%|    0.00%| 100.00%
     1|   27|   0.00%|   0.00%|    0.00%| 100.00%
     1|   28|   0.21%|   0.16%|    0.05%|  99.79%
     1|   29|   0.00%|   0.00%|    0.00%| 100.00%
     1|   30|   0.05%|   0.05%|    0.00%|  99.95%
     1|   31|   0.00%|   0.00%|    0.00%| 100.00%
-------------------------------------------
        avg.|   1.97%|   0.24%|    1.73%|  98.03%

Total IO
thread |       bytes     |     I/Os     |    MiB/s   |  I/O per s |  AvgLat  | IopsStdDev | LatStdDev |  file
------------------------------------------------------------------------------------------------------------------
     0 |      5959499776 |      1454956 |     189.43 |   48492.95 |    0.020 |    1325.03 |     0.018 | testfile.dat (100GiB)
     1 |      5964623872 |      1456207 |     189.59 |   48534.64 |    0.020 |    1334.26 |     0.018 | testfile.dat (100GiB)
------------------------------------------------------------------------------------------------------------------
total:       11924123648 |      2911163 |     379.01 |   97027.59 |    0.020 |    2658.42 |     0.018

Read IO
thread |       bytes     |     I/Os     |    MiB/s   |  I/O per s |  AvgLat  | IopsStdDev | LatStdDev |  file
------------------------------------------------------------------------------------------------------------------
     0 |               0 |            0 |       0.00 |       0.00 |    0.000 |       0.00 |       N/A | testfile.dat (100GiB)
     1 |               0 |            0 |       0.00 |       0.00 |    0.000 |       0.00 |       N/A | testfile.dat (100GiB)
------------------------------------------------------------------------------------------------------------------
total:                 0 |            0 |       0.00 |       0.00 |    0.000 |       0.00 |       N/A

Write IO
thread |       bytes     |     I/Os     |    MiB/s   |  I/O per s |  AvgLat  | IopsStdDev | LatStdDev |  file
------------------------------------------------------------------------------------------------------------------
     0 |      5959499776 |      1454956 |     189.43 |   48492.95 |    0.020 |    1325.03 |     0.018 | testfile.dat (100GiB)
     1 |      5964623872 |      1456207 |     189.59 |   48534.64 |    0.020 |    1334.26 |     0.018 | testfile.dat (100GiB)
------------------------------------------------------------------------------------------------------------------
total:       11924123648 |      2911163 |     379.01 |   97027.59 |    0.020 |    2658.42 |     0.018


total:
  %-ile |  Read (ms) | Write (ms) | Total (ms)
----------------------------------------------
    min |        N/A |      0.011 |      0.011
   25th |        N/A |      0.014 |      0.014
   50th |        N/A |      0.014 |      0.014
   75th |        N/A |      0.024 |      0.024
   90th |        N/A |      0.044 |      0.044
   95th |        N/A |      0.045 |      0.045
   99th |        N/A |      0.050 |      0.050
3-nines |        N/A |      0.094 |      0.094
4-nines |        N/A |      0.197 |      0.197
5-nines |        N/A |      0.284 |      0.284
6-nines |        N/A |      7.093 |      7.093
7-nines |        N/A |     14.945 |     14.945
8-nines |        N/A |     14.945 |     14.945
9-nines |        N/A |     14.945 |     14.945
    max |        N/A |     14.945 |     14.945
3、使用2个线程和1个未完成的IO进行64KB顺序写入
diskspd.exe  -t2 -si64K -b64K -d30 -L -o1 -w100 -D -h testfile.dat

D:\>diskspd.exe  -t2 -si64K -b64K -d30 -L -o1 -w100 -D -h testfile.dat

Command Line: diskspd.exe -t2 -si64K -b64K -d30 -L -o1 -w100 -D -h testfile.dat

Input parameters:

        timespan:   1
        -------------
        duration: 30s
        warm up time: 5s
        cool down time: 0s
        measuring latency
        gathering IOPS at intervals of 1000ms
        random seed: 0
        path: 'testfile.dat'
                think time: 0ms
                burst size: 0
                software cache disabled
                hardware write cache disabled, writethrough on
                performing write test
                block size: 65536
                using interlocked sequential I/O (stride: 65536)
                number of outstanding I/O operations: 1
                thread stride size: 0
                threads per file: 2
                IO priority: normal

System information:

        computer name: WIN-43Q2JUQ3N4D
        start time: 2020/11/08 14:44:43 UTC

Results for timespan 1:
*******************************************************************************

actual test time:       30.02s
thread count:           2
proc count:             64

Group | CPU |  Usage |  User  |  Kernel |  Idle
-------------------------------------------
     0|    0|  39.56%|   2.92%|   36.65%|  60.44%
     0|    1|  38.16%|   2.45%|   35.71%|  61.84%
     0|    2|   0.00%|   0.00%|    0.00%| 100.00%
     0|    3|   0.00%|   0.00%|    0.00%| 100.00%
     0|    4|   0.00%|   0.00%|    0.00%| 100.00%
     0|    5|   0.00%|   0.00%|    0.00%| 100.00%
     0|    6|   0.05%|   0.00%|    0.05%|  99.95%
     0|    7|   0.10%|   0.00%|    0.10%|  99.90%
     0|    8|   0.00%|   0.00%|    0.00%| 100.00%
     0|    9|   0.00%|   0.00%|    0.00%| 100.00%
     0|   10|   0.00%|   0.00%|    0.00%| 100.00%
     0|   11|   0.05%|   0.05%|    0.00%|  99.95%
     0|   12|   0.00%|   0.00%|    0.00%| 100.00%
     0|   13|   0.99%|   0.42%|    0.57%|  99.01%
     0|   14|   0.00%|   0.00%|    0.00%| 100.00%
     0|   15|   0.10%|   0.05%|    0.05%|  99.90%
     0|   16|   0.00%|   0.00%|    0.00%| 100.00%
     0|   17|   0.16%|   0.10%|    0.05%|  99.84%
     0|   18|   0.00%|   0.00%|    0.00%| 100.00%
     0|   19|   0.00%|   0.00%|    0.00%| 100.00%
     0|   20|   0.00%|   0.00%|    0.00%| 100.00%
     0|   21|   0.00%|   0.00%|    0.00%| 100.00%
     0|   22|   0.00%|   0.00%|    0.00%| 100.00%
     0|   23|   0.00%|   0.00%|    0.00%| 100.00%
     0|   24|   0.00%|   0.00%|    0.00%| 100.00%
     0|   25|   0.00%|   0.00%|    0.00%| 100.00%
     0|   26|   0.00%|   0.00%|    0.00%| 100.00%
     0|   27|   0.00%|   0.00%|    0.00%| 100.00%
     0|   28|   0.00%|   0.00%|    0.00%| 100.00%
     0|   29|   0.00%|   0.00%|    0.00%| 100.00%
     0|   30|   0.00%|   0.00%|    0.00%| 100.00%
     0|   31|   0.00%|   0.00%|    0.00%| 100.00%
     1|    0|   0.00%|   0.00%|    0.00%| 100.00%
     1|    1|   0.00%|   0.00%|    0.00%| 100.00%
     1|    2|   0.00%|   0.00%|    0.00%| 100.00%
     1|    3|   0.10%|   0.05%|    0.05%|  99.90%
     1|    4|   0.00%|   0.00%|    0.00%| 100.00%
     1|    5|   0.00%|   0.00%|    0.00%| 100.00%
     1|    6|   0.00%|   0.00%|    0.00%| 100.00%
     1|    7|   0.00%|   0.00%|    0.00%| 100.00%
     1|    8|   0.00%|   0.00%|    0.00%| 100.00%
     1|    9|   0.00%|   0.00%|    0.00%| 100.00%
     1|   10|   0.00%|   0.00%|    0.00%| 100.00%
     1|   11|   0.00%|   0.00%|    0.00%| 100.00%
     1|   12|   0.00%|   0.00%|    0.00%| 100.00%
     1|   13|   0.00%|   0.00%|    0.00%| 100.00%
     1|   14|   0.00%|   0.00%|    0.00%| 100.00%
     1|   15|   0.05%|   0.05%|    0.00%|  99.95%
     1|   16|   0.00%|   0.00%|    0.00%| 100.00%
     1|   17|   0.00%|   0.00%|    0.00%| 100.00%
     1|   18|   0.00%|   0.00%|    0.00%| 100.00%
     1|   19|   0.00%|   0.00%|    0.00%| 100.00%
     1|   20|   0.00%|   0.00%|    0.00%| 100.00%
     1|   21|   0.16%|   0.05%|    0.10%|  99.84%
     1|   22|   0.00%|   0.00%|    0.00%| 100.00%
     1|   23|   0.00%|   0.00%|    0.00%| 100.00%
     1|   24|   0.05%|   0.05%|    0.00%|  99.95%
     1|   25|   0.00%|   0.00%|    0.00%| 100.00%
     1|   26|   0.00%|   0.00%|    0.00%| 100.00%
     1|   27|   0.00%|   0.00%|    0.00%| 100.00%
     1|   28|   0.00%|   0.00%|    0.00%| 100.00%
     1|   29|   0.00%|   0.00%|    0.00%| 100.00%
     1|   30|   0.00%|   0.00%|    0.00%| 100.00%
     1|   31|   0.00%|   0.00%|    0.00%| 100.00%
-------------------------------------------
        avg.|   1.24%|   0.10%|    1.15%|  98.76%

Total IO
thread |       bytes     |     I/Os     |    MiB/s   |  I/O per s |  AvgLat  | IopsStdDev | LatStdDev |  file
------------------------------------------------------------------------------------------------------------------
     0 |     31029395456 |       473471 |     985.89 |   15774.29 |    0.063 |     567.47 |     0.028 | testfile.dat (100GiB)
     1 |     31035228160 |       473560 |     986.08 |   15777.26 |    0.063 |     570.44 |     0.028 | testfile.dat (100GiB)
------------------------------------------------------------------------------------------------------------------
total:       62064623616 |       947031 |    1971.97 |   31551.55 |    0.063 |    1137.71 |     0.028

Read IO
thread |       bytes     |     I/Os     |    MiB/s   |  I/O per s |  AvgLat  | IopsStdDev | LatStdDev |  file
------------------------------------------------------------------------------------------------------------------
     0 |               0 |            0 |       0.00 |       0.00 |    0.000 |       0.00 |       N/A | testfile.dat (100GiB)
     1 |               0 |            0 |       0.00 |       0.00 |    0.000 |       0.00 |       N/A | testfile.dat (100GiB)
------------------------------------------------------------------------------------------------------------------
total:                 0 |            0 |       0.00 |       0.00 |    0.000 |       0.00 |       N/A

Write IO
thread |       bytes     |     I/Os     |    MiB/s   |  I/O per s |  AvgLat  | IopsStdDev | LatStdDev |  file
------------------------------------------------------------------------------------------------------------------
     0 |     31029395456 |       473471 |     985.89 |   15774.29 |    0.063 |     567.47 |     0.028 | testfile.dat (100GiB)
     1 |     31035228160 |       473560 |     986.08 |   15777.26 |    0.063 |     570.44 |     0.028 | testfile.dat (100GiB)
------------------------------------------------------------------------------------------------------------------
total:       62064623616 |       947031 |    1971.97 |   31551.55 |    0.063 |    1137.71 |     0.028


total:
  %-ile |  Read (ms) | Write (ms) | Total (ms)
----------------------------------------------
    min |        N/A |      0.033 |      0.033
   25th |        N/A |      0.052 |      0.052
   50th |        N/A |      0.060 |      0.060
   75th |        N/A |      0.074 |      0.074
   90th |        N/A |      0.077 |      0.077
   95th |        N/A |      0.082 |      0.082
   99th |        N/A |      0.103 |      0.103
3-nines |        N/A |      0.251 |      0.251
4-nines |        N/A |      1.318 |      1.318
5-nines |        N/A |      1.924 |      1.924
6-nines |        N/A |      2.216 |      2.216
7-nines |        N/A |      2.216 |      2.216
8-nines |        N/A |      2.216 |      2.216
9-nines |        N/A |      2.216 |      2.216
    max |        N/A |      2.216 |      2.216
4、8KB随机读取使用2个线程,1个未完成的IO
diskspd.exe -r -t2 -b8K -d30 -L -o1 -w0 -D -h testfile.dat

D:\>diskspd.exe -r -t2 -b8K -d30 -L -o1 -w0 -D -h testfile.dat

Command Line: diskspd.exe -r -t2 -b8K -d30 -L -o1 -w0 -D -h testfile.dat

Input parameters:

        timespan:   1
        -------------
        duration: 30s
        warm up time: 5s
        cool down time: 0s
        measuring latency
        gathering IOPS at intervals of 1000ms
        random seed: 0
        path: 'testfile.dat'
                think time: 0ms
                burst size: 0
                software cache disabled
                hardware write cache disabled, writethrough on
                performing read test
                block size: 8192
                using random I/O (alignment: 8192)
                number of outstanding I/O operations: 1
                thread stride size: 0
                threads per file: 2
                IO priority: normal

System information:

        computer name: WIN-43Q2JUQ3N4D
        start time: 2020/11/08 14:46:30 UTC

Results for timespan 1:
*******************************************************************************

actual test time:       30.02s
thread count:           2
proc count:             64

Group | CPU |  Usage |  User  |  Kernel |  Idle
-------------------------------------------
     0|    0|  24.26%|   1.87%|   22.38%|  75.74%
     0|    1|  24.15%|   2.55%|   21.60%|  75.85%
     0|    2|   0.05%|   0.00%|    0.05%|  99.95%
     0|    3|   0.00%|   0.00%|    0.00%| 100.00%
     0|    4|   0.00%|   0.00%|    0.00%| 100.00%
     0|    5|   0.00%|   0.00%|    0.00%| 100.00%
     0|    6|   0.00%|   0.00%|    0.00%| 100.00%
     0|    7|   0.00%|   0.00%|    0.00%| 100.00%
     0|    8|   0.10%|   0.00%|    0.10%|  99.90%
     0|    9|   0.00%|   0.00%|    0.00%| 100.00%
     0|   10|   0.00%|   0.00%|    0.00%| 100.00%
     0|   11|   0.00%|   0.00%|    0.00%| 100.00%
     0|   12|   0.00%|   0.00%|    0.00%| 100.00%
     0|   13|   0.00%|   0.00%|    0.00%| 100.00%
     0|   14|   0.00%|   0.00%|    0.00%| 100.00%
     0|   15|   0.00%|   0.00%|    0.00%| 100.00%
     0|   16|   0.00%|   0.00%|    0.00%| 100.00%
     0|   17|   0.00%|   0.00%|    0.00%| 100.00%
     0|   18|   0.00%|   0.00%|    0.00%| 100.00%
     0|   19|   0.00%|   0.00%|    0.00%| 100.00%
     0|   20|   0.00%|   0.00%|    0.00%| 100.00%
     0|   21|   0.00%|   0.00%|    0.00%| 100.00%
     0|   22|   0.00%|   0.00%|    0.00%| 100.00%
     0|   23|   0.00%|   0.00%|    0.00%| 100.00%
     0|   24|   0.00%|   0.00%|    0.00%| 100.00%
     0|   25|   0.00%|   0.00%|    0.00%| 100.00%
     0|   26|   0.00%|   0.00%|    0.00%| 100.00%
     0|   27|   0.00%|   0.00%|    0.00%| 100.00%
     0|   28|   0.00%|   0.00%|    0.00%| 100.00%
     0|   29|   0.00%|   0.00%|    0.00%| 100.00%
     0|   30|   0.00%|   0.00%|    0.00%| 100.00%
     0|   31|   0.00%|   0.00%|    0.00%| 100.00%
     1|    0|   0.21%|   0.21%|    0.00%|  99.79%
     1|    1|   0.00%|   0.00%|    0.00%| 100.00%
     1|    2|   0.21%|   0.16%|    0.05%|  99.79%
     1|    3|   0.16%|   0.10%|    0.05%|  99.84%
     1|    4|   0.10%|   0.10%|    0.00%|  99.90%
     1|    5|   0.21%|   0.21%|    0.00%|  99.79%
     1|    6|   0.05%|   0.05%|    0.00%|  99.95%
     1|    7|   0.10%|   0.00%|    0.10%|  99.90%
     1|    8|   0.00%|   0.00%|    0.00%| 100.00%
     1|    9|   0.00%|   0.00%|    0.00%| 100.00%
     1|   10|   0.16%|   0.16%|    0.00%|  99.84%
     1|   11|   0.16%|   0.16%|    0.00%|  99.84%
     1|   12|   0.10%|   0.05%|    0.05%|  99.90%
     1|   13|   0.16%|   0.16%|    0.00%|  99.84%
     1|   14|   0.26%|   0.26%|    0.00%|  99.74%
     1|   15|   0.21%|   0.21%|    0.00%|  99.79%
     1|   16|   0.10%|   0.10%|    0.00%|  99.90%
     1|   17|   0.05%|   0.05%|    0.00%|  99.95%
     1|   18|   0.10%|   0.10%|    0.00%|  99.90%
     1|   19|   0.16%|   0.16%|    0.00%|  99.84%
     1|   20|   0.00%|   0.00%|    0.00%| 100.00%
     1|   21|   1.20%|   0.31%|    0.88%|  98.80%
     1|   22|   0.16%|   0.10%|    0.05%|  99.84%
     1|   23|   2.24%|   0.21%|    2.03%|  97.76%
     1|   24|   0.16%|   0.10%|    0.05%|  99.84%
     1|   25|   0.10%|   0.10%|    0.00%|  99.90%
     1|   26|   0.00%|   0.00%|    0.00%| 100.00%
     1|   27|   0.10%|   0.10%|    0.00%|  99.90%
     1|   28|   0.00%|   0.00%|    0.00%| 100.00%
     1|   29|   0.05%|   0.05%|    0.00%|  99.95%
     1|   30|   0.26%|   0.26%|    0.00%|  99.74%
     1|   31|   0.21%|   0.16%|    0.05%|  99.79%
-------------------------------------------
        avg.|   0.87%|   0.13%|    0.74%|  99.13%

Total IO
thread |       bytes     |     I/Os     |    MiB/s   |  I/O per s |  AvgLat  | IopsStdDev | LatStdDev |  file
------------------------------------------------------------------------------------------------------------------
     0 |      2027700224 |       247522 |      64.43 |    8246.56 |    0.120 |      44.25 |     0.062 | testfile.dat (100GiB)
     1 |      2027716608 |       247524 |      64.43 |    8246.62 |    0.120 |      54.32 |     0.062 | testfile.dat (100GiB)
------------------------------------------------------------------------------------------------------------------
total:        4055416832 |       495046 |     128.85 |   16493.18 |    0.120 |      68.60 |     0.062

Read IO
thread |       bytes     |     I/Os     |    MiB/s   |  I/O per s |  AvgLat  | IopsStdDev | LatStdDev |  file
------------------------------------------------------------------------------------------------------------------
     0 |      2027700224 |       247522 |      64.43 |    8246.56 |    0.120 |      44.25 |     0.062 | testfile.dat (100GiB)
     1 |      2027716608 |       247524 |      64.43 |    8246.62 |    0.120 |      54.32 |     0.062 | testfile.dat (100GiB)
------------------------------------------------------------------------------------------------------------------
total:        4055416832 |       495046 |     128.85 |   16493.18 |    0.120 |      68.60 |     0.062

Write IO
thread |       bytes     |     I/Os     |    MiB/s   |  I/O per s |  AvgLat  | IopsStdDev | LatStdDev |  file
------------------------------------------------------------------------------------------------------------------
     0 |               0 |            0 |       0.00 |       0.00 |    0.000 |       0.00 |       N/A | testfile.dat (100GiB)
     1 |               0 |            0 |       0.00 |       0.00 |    0.000 |       0.00 |       N/A | testfile.dat (100GiB)
------------------------------------------------------------------------------------------------------------------
total:                 0 |            0 |       0.00 |       0.00 |    0.000 |       0.00 |       N/A


total:
  %-ile |  Read (ms) | Write (ms) | Total (ms)
----------------------------------------------
    min |      0.026 |        N/A |      0.026
   25th |      0.047 |        N/A |      0.047
   50th |      0.131 |        N/A |      0.131
   75th |      0.160 |        N/A |      0.160
   90th |      0.199 |        N/A |      0.199
   95th |      0.202 |        N/A |      0.202
   99th |      0.211 |        N/A |      0.211
3-nines |      0.295 |        N/A |      0.295
4-nines |      0.361 |        N/A |      0.361
5-nines |      0.437 |        N/A |      0.437
6-nines |      3.900 |        N/A |      3.900
7-nines |      3.900 |        N/A |      3.900
8-nines |      3.900 |        N/A |      3.900
9-nines |      3.900 |        N/A |      3.900
    max |      3.900 |        N/A |      3.900
5、使用2个线程和1个未完成的IO进行128KB随机读取
diskspd.exe -r -t2 -b128K -d30 -L -o1 -w0 -D -h testfile.dat

D:\>diskspd.exe -r -t2 -b128K -d30 -L -o1 -w0 -D -h testfile.dat

Command Line: diskspd.exe -r -t2 -b128K -d30 -L -o1 -w0 -D -h testfile.dat

Input parameters:

        timespan:   1
        -------------
        duration: 30s
        warm up time: 5s
        cool down time: 0s
        measuring latency
        gathering IOPS at intervals of 1000ms
        random seed: 0
        path: 'testfile.dat'
                think time: 0ms
                burst size: 0
                software cache disabled
                hardware write cache disabled, writethrough on
                performing read test
                block size: 131072
                using random I/O (alignment: 131072)
                number of outstanding I/O operations: 1
                thread stride size: 0
                threads per file: 2
                IO priority: normal

System information:

        computer name: WIN-43Q2JUQ3N4D
        start time: 2020/11/08 14:48:56 UTC

Results for timespan 1:
*******************************************************************************

actual test time:       30.01s
thread count:           2
proc count:             64

Group | CPU |  Usage |  User  |  Kernel |  Idle
-------------------------------------------
     0|    0|  12.86%|   1.04%|   11.82%|  87.14%
     0|    1|  13.44%|   0.83%|   12.60%|  86.56%
     0|    2|   0.00%|   0.00%|    0.00%| 100.00%
     0|    3|   0.00%|   0.00%|    0.00%| 100.00%
     0|    4|   0.00%|   0.00%|    0.00%| 100.00%
     0|    5|   0.00%|   0.00%|    0.00%| 100.00%
     0|    6|   0.00%|   0.00%|    0.00%| 100.00%
     0|    7|   0.00%|   0.00%|    0.00%| 100.00%
     0|    8|   0.00%|   0.00%|    0.00%| 100.00%
     0|    9|   0.00%|   0.00%|    0.00%| 100.00%
     0|   10|   0.00%|   0.00%|    0.00%| 100.00%
     0|   11|   0.00%|   0.00%|    0.00%| 100.00%
     0|   12|   0.00%|   0.00%|    0.00%| 100.00%
     0|   13|   0.00%|   0.00%|    0.00%| 100.00%
     0|   14|   0.00%|   0.00%|    0.00%| 100.00%
     0|   15|   0.00%|   0.00%|    0.00%| 100.00%
     0|   16|   0.00%|   0.00%|    0.00%| 100.00%
     0|   17|   0.00%|   0.00%|    0.00%| 100.00%
     0|   18|   0.00%|   0.00%|    0.00%| 100.00%
     0|   19|   0.00%|   0.00%|    0.00%| 100.00%
     0|   20|   0.00%|   0.00%|    0.00%| 100.00%
     0|   21|   0.00%|   0.00%|    0.00%| 100.00%
     0|   22|   0.00%|   0.00%|    0.00%| 100.00%
     0|   23|   0.00%|   0.00%|    0.00%| 100.00%
     0|   24|   0.00%|   0.00%|    0.00%| 100.00%
     0|   25|   0.00%|   0.00%|    0.00%| 100.00%
     0|   26|   0.00%|   0.00%|    0.00%| 100.00%
     0|   27|   0.00%|   0.00%|    0.00%| 100.00%
     0|   28|   0.00%|   0.00%|    0.00%| 100.00%
     0|   29|   0.00%|   0.00%|    0.00%| 100.00%
     0|   30|   0.00%|   0.00%|    0.00%| 100.00%
     0|   31|   0.00%|   0.00%|    0.00%| 100.00%
     1|    0|   0.00%|   0.00%|    0.00%| 100.00%
     1|    1|   0.00%|   0.00%|    0.00%| 100.00%
     1|    2|   0.00%|   0.00%|    0.00%| 100.00%
     1|    3|   0.00%|   0.00%|    0.00%| 100.00%
     1|    4|   0.00%|   0.00%|    0.00%| 100.00%
     1|    5|   0.00%|   0.00%|    0.00%| 100.00%
     1|    6|   0.00%|   0.00%|    0.00%| 100.00%
     1|    7|   0.00%|   0.00%|    0.00%| 100.00%
     1|    8|   0.00%|   0.00%|    0.00%| 100.00%
     1|    9|   0.00%|   0.00%|    0.00%| 100.00%
     1|   10|   0.00%|   0.00%|    0.00%| 100.00%
     1|   11|   0.00%|   0.00%|    0.00%| 100.00%
     1|   12|   0.00%|   0.00%|    0.00%| 100.00%
     1|   13|   0.00%|   0.00%|    0.00%| 100.00%
     1|   14|   0.00%|   0.00%|    0.00%| 100.00%
     1|   15|   0.00%|   0.00%|    0.00%| 100.00%
     1|   16|   0.00%|   0.00%|    0.00%| 100.00%
     1|   17|   0.00%|   0.00%|    0.00%| 100.00%
     1|   18|   0.00%|   0.00%|    0.00%| 100.00%
     1|   19|   0.00%|   0.00%|    0.00%| 100.00%
     1|   20|   0.00%|   0.00%|    0.00%| 100.00%
     1|   21|   0.00%|   0.00%|    0.00%| 100.00%
     1|   22|   0.00%|   0.00%|    0.00%| 100.00%
     1|   23|   0.00%|   0.00%|    0.00%| 100.00%
     1|   24|   0.00%|   0.00%|    0.00%| 100.00%
     1|   25|   0.00%|   0.00%|    0.00%| 100.00%
     1|   26|   0.00%|   0.00%|    0.00%| 100.00%
     1|   27|   0.00%|   0.00%|    0.00%| 100.00%
     1|   28|   0.00%|   0.00%|    0.00%| 100.00%
     1|   29|   0.00%|   0.00%|    0.00%| 100.00%
     1|   30|   0.05%|   0.00%|    0.05%|  99.95%
     1|   31|   0.00%|   0.00%|    0.00%| 100.00%
-------------------------------------------
        avg.|   0.41%|   0.03%|    0.38%|  99.59%

Total IO
thread |       bytes     |     I/Os     |    MiB/s   |  I/O per s |  AvgLat  | IopsStdDev | LatStdDev |  file
------------------------------------------------------------------------------------------------------------------
     0 |     11834621952 |        90291 |     376.11 |    3008.84 |    0.331 |      39.55 |     0.200 | testfile.dat (100GiB)
     1 |     11860967424 |        90492 |     376.94 |    3015.54 |    0.330 |      33.80 |     0.200 | testfile.dat (100GiB)
------------------------------------------------------------------------------------------------------------------
total:       23695589376 |       180783 |     753.05 |    6024.38 |    0.331 |      45.34 |     0.200

Read IO
thread |       bytes     |     I/Os     |    MiB/s   |  I/O per s |  AvgLat  | IopsStdDev | LatStdDev |  file
------------------------------------------------------------------------------------------------------------------
     0 |     11834621952 |        90291 |     376.11 |    3008.84 |    0.331 |      39.55 |     0.200 | testfile.dat (100GiB)
     1 |     11860967424 |        90492 |     376.94 |    3015.54 |    0.330 |      33.80 |     0.200 | testfile.dat (100GiB)
------------------------------------------------------------------------------------------------------------------
total:       23695589376 |       180783 |     753.05 |    6024.38 |    0.331 |      45.34 |     0.200

Write IO
thread |       bytes     |     I/Os     |    MiB/s   |  I/O per s |  AvgLat  | IopsStdDev | LatStdDev |  file
------------------------------------------------------------------------------------------------------------------
     0 |               0 |            0 |       0.00 |       0.00 |    0.000 |       0.00 |       N/A | testfile.dat (100GiB)
     1 |               0 |            0 |       0.00 |       0.00 |    0.000 |       0.00 |       N/A | testfile.dat (100GiB)
------------------------------------------------------------------------------------------------------------------
total:                 0 |            0 |       0.00 |       0.00 |    0.000 |       0.00 |       N/A


total:
  %-ile |  Read (ms) | Write (ms) | Total (ms)
----------------------------------------------
    min |      0.085 |        N/A |      0.085
   25th |      0.097 |        N/A |      0.097
   50th |      0.297 |        N/A |      0.297
   75th |      0.536 |        N/A |      0.536
   90th |      0.574 |        N/A |      0.574
   95th |      0.593 |        N/A |      0.593
   99th |      0.712 |        N/A |      0.712
3-nines |      0.865 |        N/A |      0.865
4-nines |      1.108 |        N/A |      1.108
5-nines |      4.007 |        N/A |      4.007
6-nines |      4.115 |        N/A |      4.115
7-nines |      4.115 |        N/A |      4.115
8-nines |      4.115 |        N/A |      4.115
9-nines |      4.115 |        N/A |      4.115
    max |      4.115 |        N/A |      4.115

D:\>
6、测试举例

http://pugchallenge.org/downloads2016/681%20-%20diskspd_documentation.pdf
7、SQL Server 返回数据和日志文件的 I/O 统计信息。 此动态管理视图替换 fn_virtualfilestats 函数。
--以下示例将返回有关 AdventureWorks2012 数据库中的日志文件的统计信息。
SELECT * FROM sys.dm_io_virtual_file_stats(DB_ID(N'AdventureWorks2012'), 2);

--返回 tempdb 中文件的统计信息
SELECT * FROM sys.dm_pdw_nodes_io_virtual_file_stats
WHERE database_name = 'tempdb' AND file_id = 2;


文章评论